Vancouver School District
Historical Demographics Including Total Enrollment Trends
SBA Information
Note:
There are 4 levels for the SBA with historical definitions of:
- Level 1: Standard Not Met
- Level 2: Standard Nearly Met
- Level 3: Standard Met
- Level 4: Standard Exceeded
Prior to 2025, the OSPI declared Level 3 and above as proficient. As of 2025, the OSPI lowered their bar to Level 2 and above and redefined it as Students Showing Foundational Grade-Level Knowledge. For this report, Level 3 and above is still used as the measure of proficiency.
SBA 4th Grade ELA
SBA 4th Grade MATH
SBA 8th Grade ELA
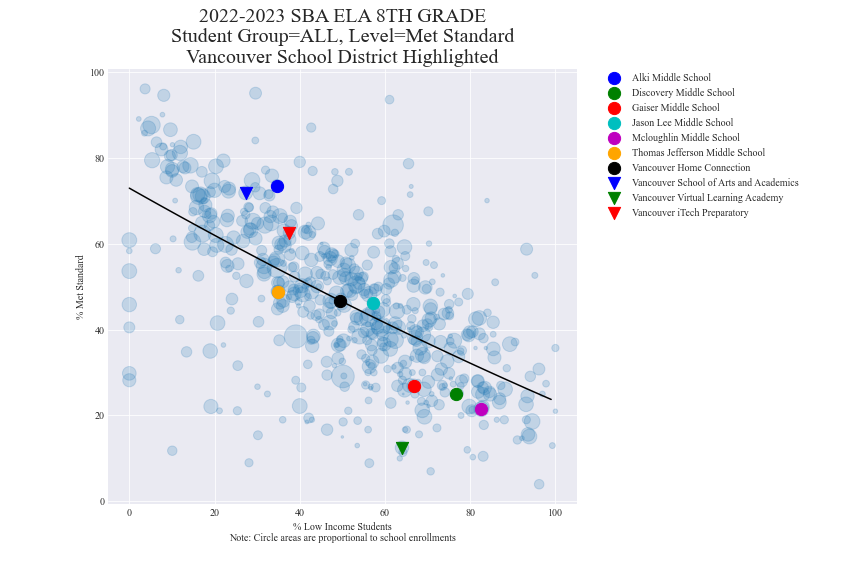
SBA 8th Grade MATH
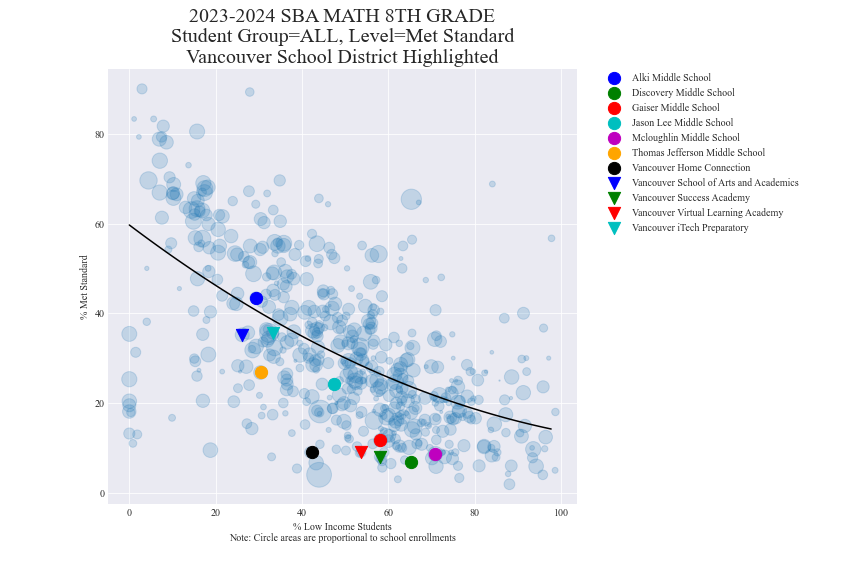
SBA 10th Grade ELA
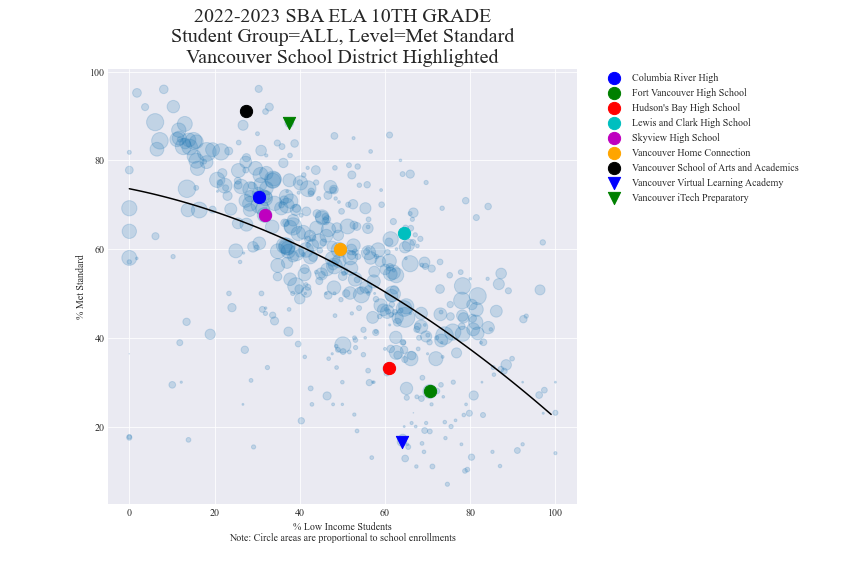
SBA 10th Grade MATH
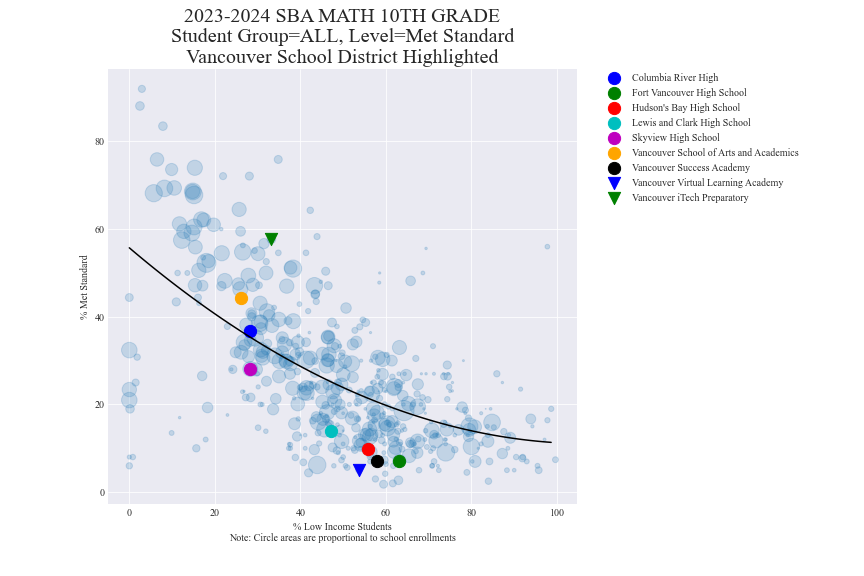
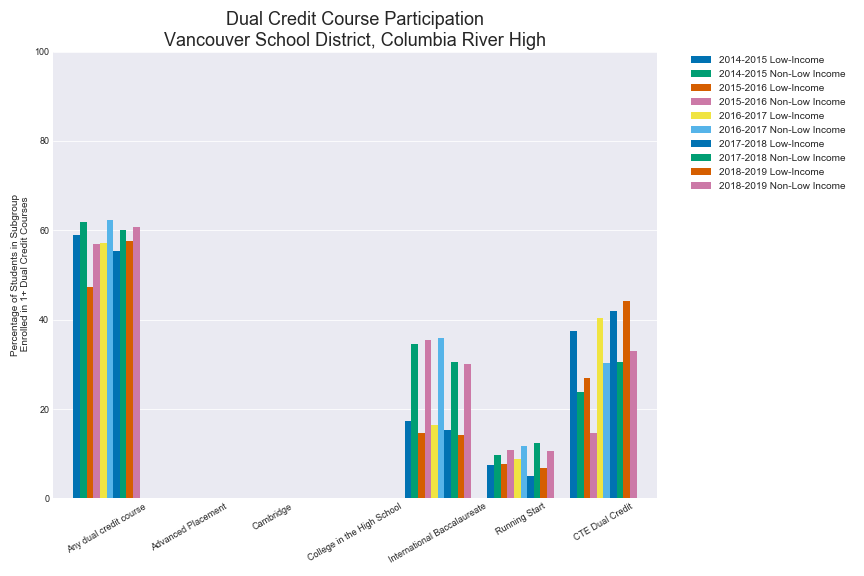
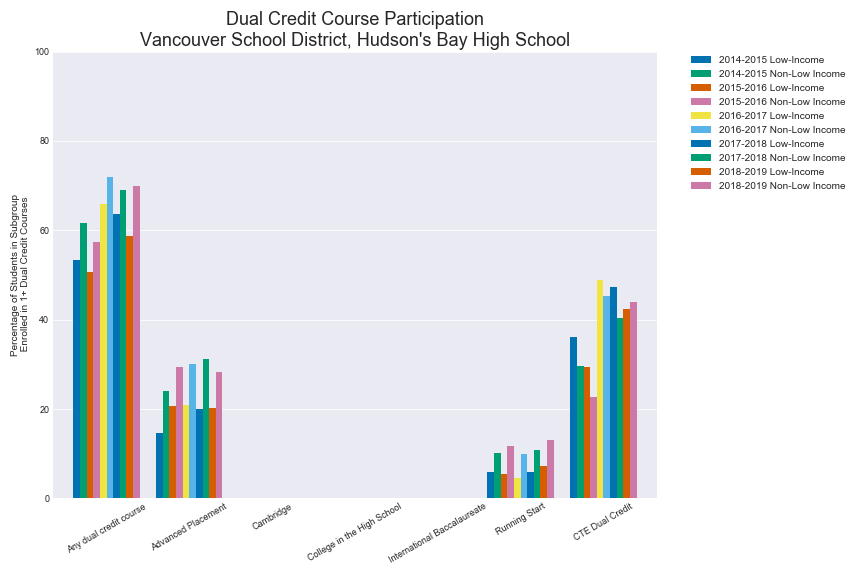
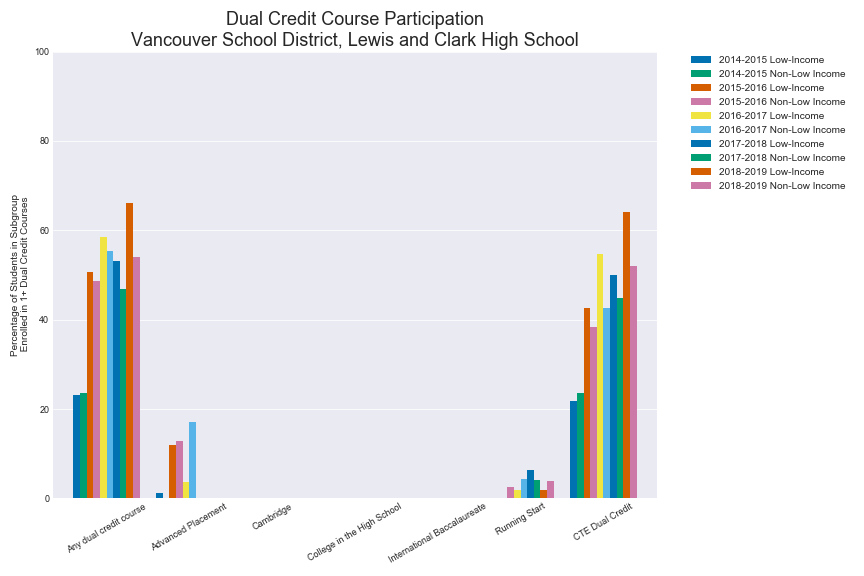
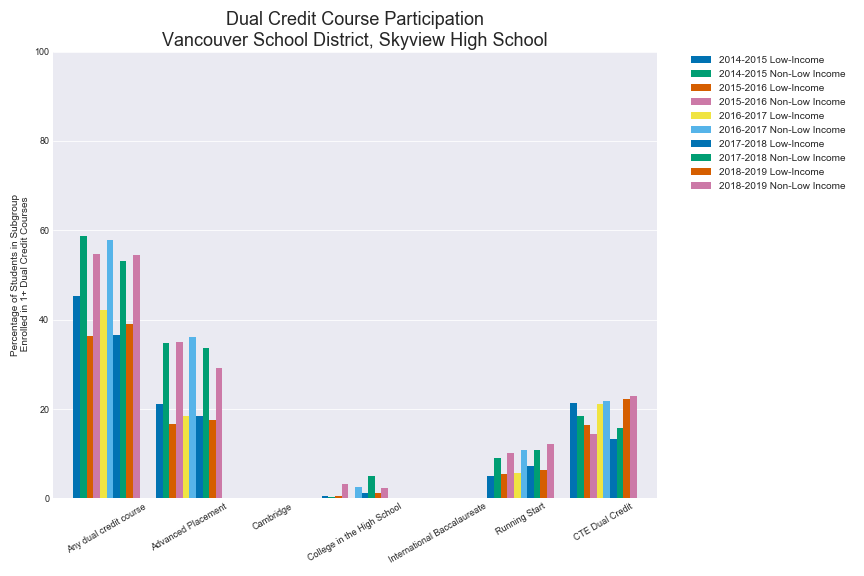
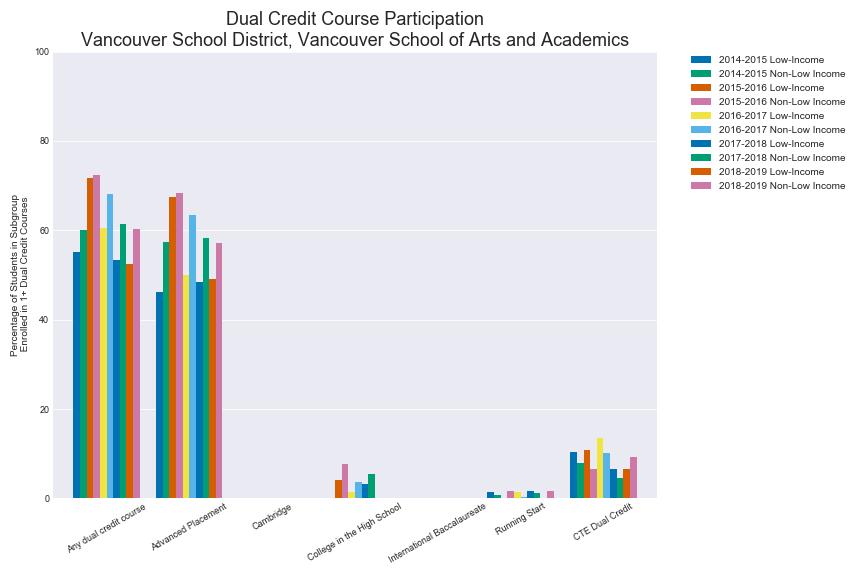
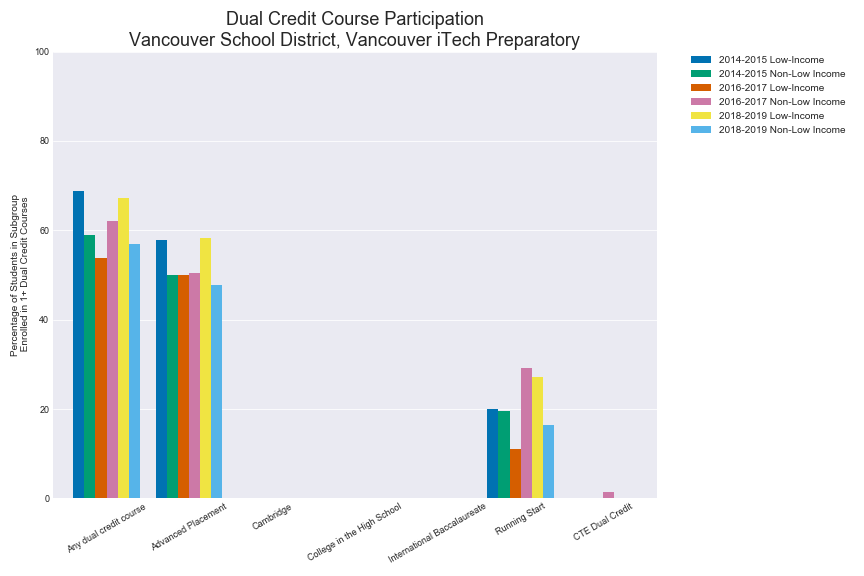
Dual Credit Participation
Vancouver School of Arts and Academics
Vancouver Virtual Learning Academy
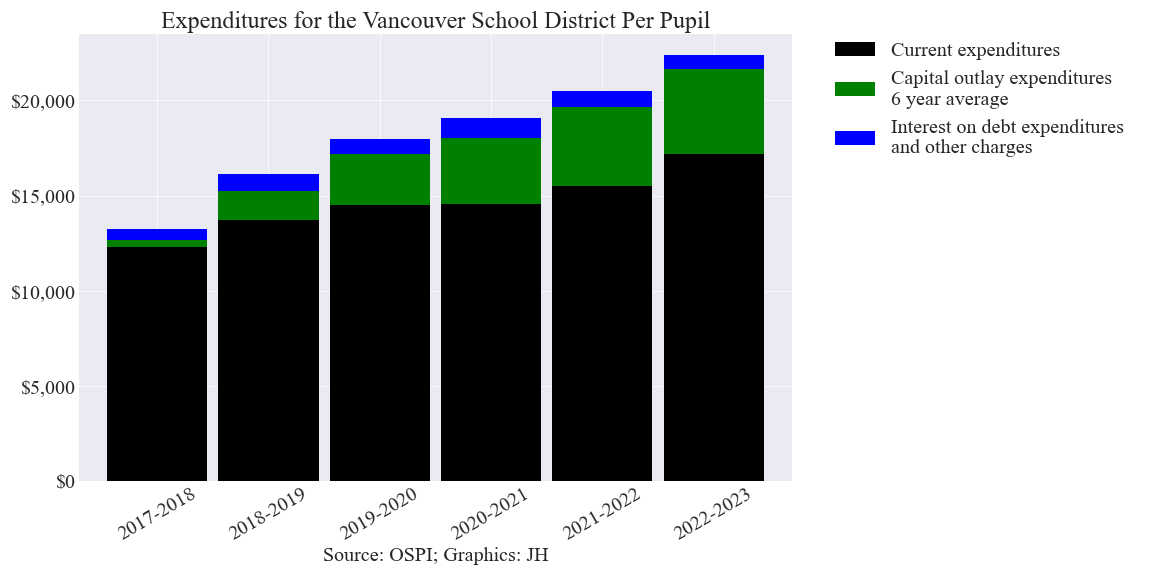
Budget Information
Note:
The OSPI’s definition of Per Pupil Expenditures (PPE) only includes the General Fund. The PPE used here includes:
- Capital Projects Fund expenses. These are capital outlays which are usually purchased from funds from local capital levies and/or local bonds.
- ASB Fund expenses.
- Transportation Vehicle Fund expenses.
- Interest on debt. This can be substantial since it is mostly bond interest from 10 to 27 year bonds.
The enrollments used in these PPE charts are Annual Average Full-Time Equivalent (AAFTE) enrollments.
Historical Total Expenses Per Student
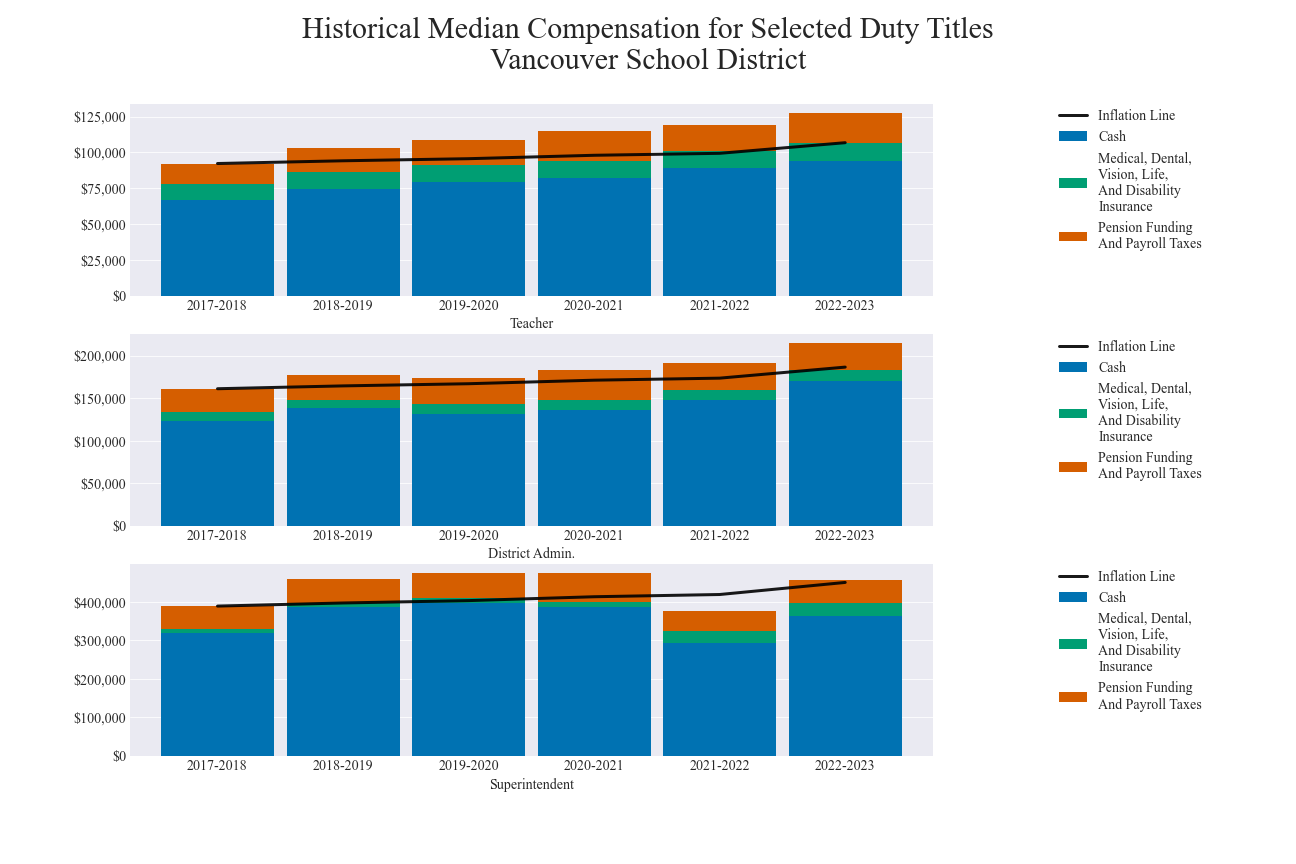
Historical Compensation Information
Note:
- All compensation data are from the OSPI’s S275 reports.
- District Admin. includes duty titles of Deputy/Assist. Supt., Director/Supervisor, Other District Admin.
- Principal includes duty titles of Elementary Principal, Secondary Principal
- Teacher includes duty titles of Elem. Homeroom Teacher, Elem. Specialist Teacher, Other Teacher, Secondary Teacher
- Total Salary (Cash) = Base Salary + Supplemental Salary
- Total Compensation = Total Salary + Insurance Benefits + Mandatory Benefits
- Mandatory Benefits include pension funding and payroll taxes
- Inflation data source: U.S. Bureau of Labor Statistics. Consumer Price Index for All Urban Consumers (CPI-U)